Petabytes of data that have not been accessed for years, all kept because the cost to acquire it was substantial and the strong sense that it may be useful again is lurking in the back of everyone’s mind. Every oil company has it, but most don’t know what to do with it.
Historically, oil and gas companies have archived their data off to tape and stored it in offsite storage. If a company needs to use the data again, they are usually happy to wait for days or weeks to get access to the data they want. Happy may not be the emotion, maybe just resigned to how long things take. For oil companies, time is usually not something they like to waste, but with data there has been a long history of waiting in the oil sector that has somehow become the norm.
The rapidly changing big data and analytics industry is now showing mind blowing results on massive scales of data that is changing the way oil and gas companies view how their archive should be handled. One of the first things that shows itself to be a critical component to the new thinking is that the use of private clouds and private data storage solutions are simply not adequate. Systems that proclaim higher level security than public cloud usually obtain what they think is higher security by putting the data offline. Offline is the same as inaccessible. In the end, offline data is as good as offsite tape storage in a tape vault – essentially useless to the power of big data and analytics.
Private cloud data management solutions are being dumped at a record pace to adopt public cloud solutions with open architectures. The open architectures then allow for restricted and highly secure, but ready access to the new technology being built in the industry. The use of public cloud is now fully acceptable to oil and gas companies and data in record amounts are flowing into the public cloud and out of private clouds all over the world. It is safe to say that any oil company that wants to be able to use big data and analytics tools is going to need to stop putting data into private cloud, and pivot to keep pace with the technology being developed for the public cloud.
One great example of how a large well data collection has been liberated and data analytics and machine learning applied to gain new knowledge has been performed by dataVediK. Houston based dataVediK (a name based on the Sanskrit word “Veda” which means knowledge and wisdom), is an early stage start-up specialising in Big Data & Analytics, Machine Learning, Automation and end-to-end Data Ecosystems for Oil & Gas industry. dataVediK aims to decode the knowledge hidden in data by applying analytics and machine learning technologies on oil and gas datasets.
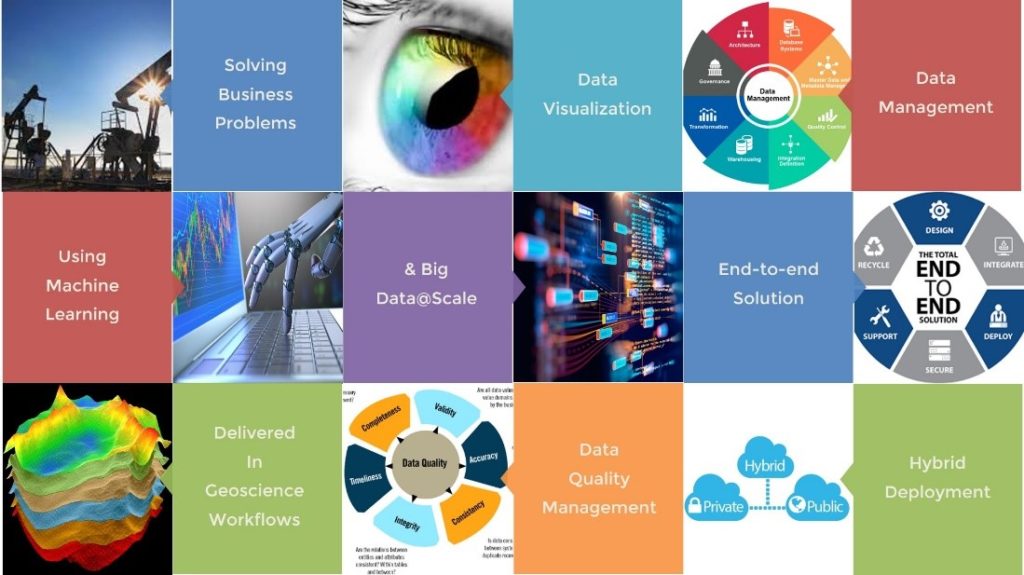
dataVediK’s mission is to solve Oil & Gas business problems by blending machine learning techniques with E&P domain expertise and delivering solutions embedded in Geoscience, Production and Drilling workflows. dataVediK also combines the Big data processing techniques with principles of data management & data quality management (DQM) to deliver end-to-end solutions using innovative user-centric visualization with flexible deployment architectures including public-cloud, on-premises and hybrid environments.
With the enormously experienced team in upstream domain, dataVediK has developed machine learning solutions for diverse problems encountered in the oil and gas industry. dataVediK’s repeatable process helps in building and training machine learning models rapidly and in a consistent fashion on a variety of datasets.
dataVediK recently demonstrated a workflow to predict formation tops by applying artificial intelligence and machine learning techniques to learn the well logs signatures. This deep learning model provides high quality predictions to aid the geologists in picking lithology markers consistently and in an accelerated fashion thus boosting their operational efficiency. The self-learning model, which is a unique differentiator of dataVediK, encompasses the detection of outliers and data quality issues and their subsequent validation and suggested corrections to improve the quality of data in an automated fashion during the model training process. As a result, the model learns from good data only and delivers results with unparalleled accuracy which makes it very appealing to not only the end-user Geoscientists, but also to the data management groups and the decision making executive stakeholders.
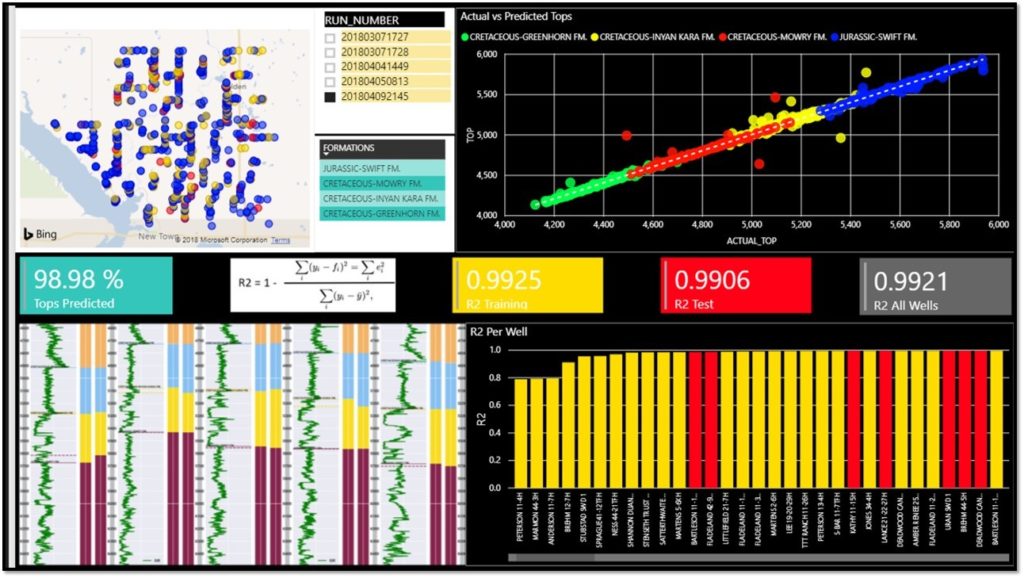
Here is a screenshot of dataVediK’s proprietary machine learning model performance dashboard using which oil & gas domain experts as well as data scientists can slice-and-dice the performance measures in different ways:
- The map image on the top left shows the location of all the wells in the Sanish Field in North Dakota with model training wells highlighted in yellow color and test wells highlighted in red.
- The Run Number image shows the version history of the model as it has evolved over a period increasingly becoming more sophisticated and accurate.
- The Formations image shows the list of the formation names for which the formation tops are being predicted by the model.
- The scatter chart on the top right shows the plot of actual versus predicted depths of the formation tops with the points for each formation highlighted in different colors.
- The boxes in the center show the various performance measures of the model including the percentage of the tops predicted as well as R2 to demonstrate the “goodness” of the model.
- The multi-well logs cross-section at the bottom left shows the actual tops versus the predicted tops in the Geologists preferred canvas.
- The image at the bottom right shows the R2 for each well with training wells highlighted in yellow and test wells highlighted in red.
This dashboard provides an integrated and dynamic view of machine learning model performance while focusing on the Oil & Gas domain, which is unique to dataVediK.
There have been 34,799 wells drilled in North Dakota, USA, which are spread over 608 fields. The model demonstrated above used data from the one field in the Williston basin with about 754 wells with an average TVD of approximately 10,000 ft and average MD of 20,000 ft effectively having the average lateral length of 10,000 ft.
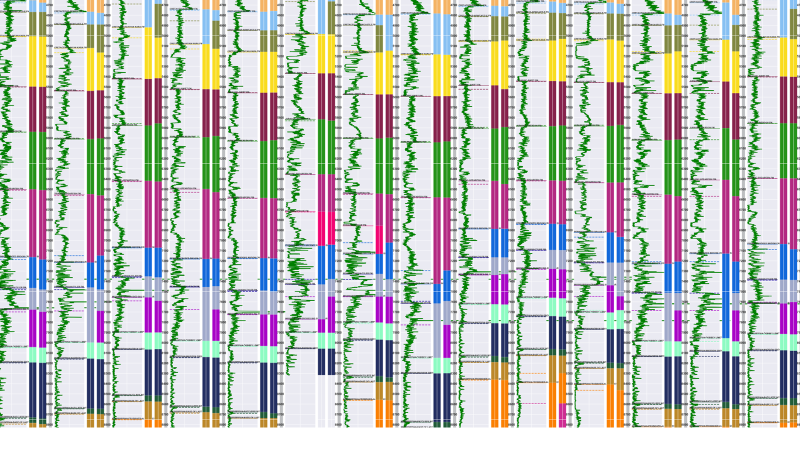
The screenshot below shows a part of the dataVediK’s multi-well logs cross-section tool incorporating the training and test wells in the field, built using big data technology to facilitate the viewing of basin and field wide cross-sections consisting of millions or even billions of well log sample points.
Leave a Reply